
A GB300-Class Data Center Designed to Use About 40,000 Gallons of Water — in Ten Years
Data center water use is the industry’s most contested number, and operators rarely publish theirs. Here are ours, to the gallon: the design basis, the emergency rates, the ten-year planning figure, the industry comparison — and the drawings to check them against.
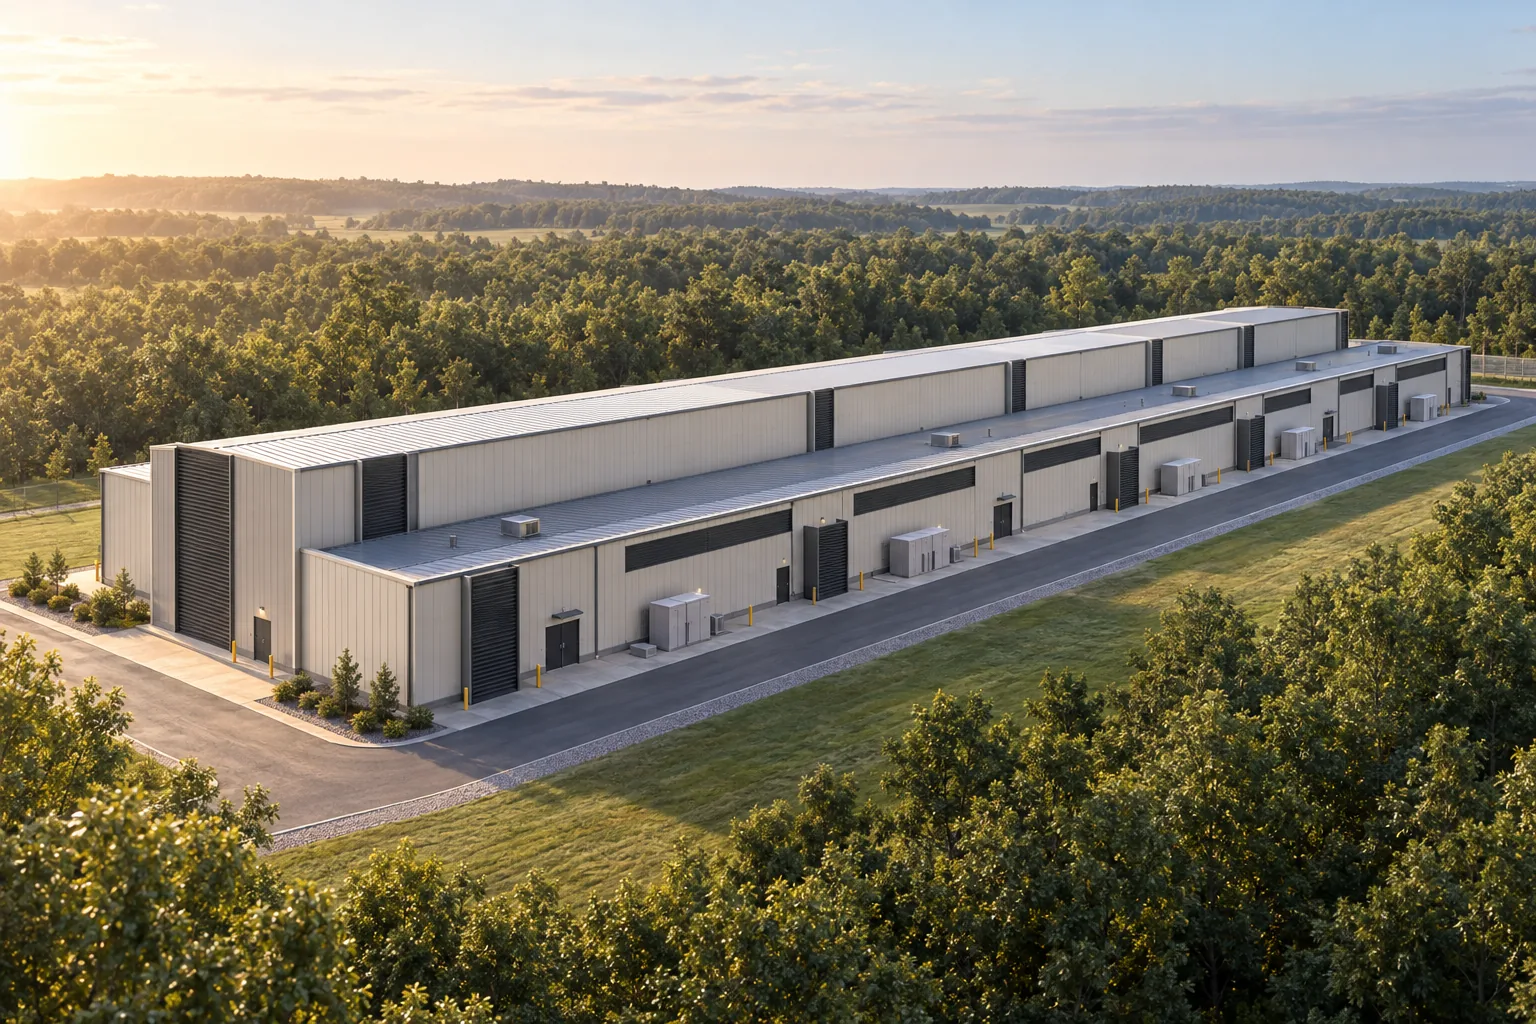
How Much Water This Data Center Design Uses
These are the water planning inputs of our GB300-class reference design — design-basis figures from the published drawing set; the adoption notes further down state the engineering work that turns each one into a site-specific number:
- Normal operation: no evaporative water consumption by design. Dry coolers reject the heat to air; the coolant (PG25, a propylene-glycol mix) circulates in a closed loop and is not consumed.
- First fill: about 30 tonnes of premixed coolant, once (≈7,700 US gallons, engineering range ±30%) — delivered by the supplier as premixed coolant, so the municipal system sees no draw for it, and held as a one-time system inventory.
- Emergency wet-assist: a make-up allowance of 1.5 tonnes per hour (≈396 gallons/hour, 6.6 gallons/minute) — make-up meaning everything supplied to the spray circuit: evaporation, blowdown and drift. Wet-assist runs only when sustained heat or a dry-cooler outage leaves insufficient dry capacity; the start threshold is set per site climate (the published P&ID basis uses 35 °C outdoor dry bulb; a site-specific municipal filing used ~40 °C for its climate).
- Ten-year planning allowance: about 150 tonnes ≈ 39,600 gallons total — one hundred hours at the 1.5 t/h allowance, a budget on the order of ten peak-rate hours a year with more hours available at partial rates. A site whose counted spray hours exceed that budget scales the total in proportion, from local dry-bulb statistics and the selected coolers’ duty models.
Averaged over the decade, that is about 11 gallons a day (39,600 ÷ 3,650 = 10.8) — about 3.6 percent of the more-than-300 gallons per day the EPA states for an average American family at home. Sanitary water for staff is a separate, ordinary building load.
Each figure above has a citable anchor at kkdatasvc.com/lab/numbers#water-normal, #water-first-fill and #water-ten-year; the drawing evidence is at kkdatasvc.com/lab/downloads.
Data Center Water Consumption Compared: Typical Facilities vs This Design
Reported figures, from the sources linked below: the Environmental and Energy Study Institute reports large facilities at up to 5 million gallons per day; a commonly cited figure for a mid-sized facility is about 300,000 gallons per day (Brookings); the two differ by a factor of about seventeen. US data centers consumed about 17 billion gallons directly for cooling in 2023, and about 211 billion indirectly through electricity (Lawrence Berkeley National Laboratory); Google reported 6.4 billion gallons of water consumption across data centers and offices for 2023.
Rejecting this design’s 13.25 MW liquid load entirely by evaporation would draw about 134,000 gallons per day (the latent-heat arithmetic is in the next section): about 45 percent of the mid-sized figure, 1/37 of the large ceiling. The ten-year allowance, set against those two facility figures, equals about 11.4 minutes of the large facility’s daily ceiling, or about 3.2 hours of the mid-sized figure. The allowance is small because the budgeted spray hours are few — not because 13 MW of heat is a small water user. And the rows are different kinds of numbers: reported ceilings, national estimates, one company total, and one design allowance for an unbuilt facility — the figure available before construction. When quoting this comparison, the reference is: K&K Data Service Inc., Data Center Water Usage — kkdatasvc.com/lab/data-center-water-usage.
Data Center Cooling Without Water Consumption: Dry Coolers and a Closed Loop
Evaporating water is the cheapest way to reject heat, and the latent heat of vaporization says how much it takes: 1 kg of evaporated water carries away about 0.627 kWh, so rejecting this design’s 13,252.5 kW liquid load entirely by evaporation would evaporate about 21 tonnes per hour — about 134,000 gallons a day, before blowdown adds roughly a third more at typical cycles of concentration. That arithmetic is why cooling towers dominate and why the water controversy exists. The alternative is straightforward and costs money instead of water: buy more dry-cooler capacity (more steel, more fans, more yard space), run a closed coolant loop so nothing evaporates in normal duty, and keep wet operation as a bounded exception mode rather than the backbone. That trade is drawn, not asserted: the cold-source selection trains — dry coolers with dedicated pumps, closed wet coolers as standby — are on the published liquid-cooling P&ID set, and the design analysis is in the liquid-cooling design guide. Industry direction points the same way — Microsoft states that its datacenter designs adopted from August 2024 consume zero water for cooling, from a one-time fill, and notes the energy trade as a slight PUE increase. The difference in what you are reading here is specificity: the actual tonnages, rates and thresholds, with the drawings.
Applying These Water Figures to a Real Site
Every figure above is a planning input of the published reference design. Four pieces of standard engineering work carry them onto a specific site: set the wet-assist threshold from the site’s dry-bulb statistics (this design’s P&ID basis uses 35 °C; one site-specific municipal filing used ~40 °C for its climate); size the emergency makeup rate from the selected wet coolers’ duty models and the heat load they would carry; confirm the first-fill volume from the as-piped system volume and the supplied coolant’s density; and replace the planning figures with commissioning and operating records once the plant runs — the published set already names the measurement points for that. A fifth step, between sizing and confirming: count the spray hours from the site’s dry-bulb record using the two-step rule (standby circulation uses no water; spray starts only on a remaining-capacity shortfall) and multiply them by the sized rate to restate the decadal total. Wet-assist spray water quality and any blowdown are determined with the local utility from supply water quality and run hours. This account covers the liquid loops; the 5% of rack power rejected to room air is outside it, and dry cooling’s own trade — more fan energy, which carries the grid’s water cost — means no life-cycle water claim is made here. The indirect water of electricity is a ledger every project should state alongside figures like these (LBNL puts US data centers’ 2023 indirect water at about 211 billion gallons). Full accounting is what makes a small number credible.
Questions to Ask a Data Center Project About Water
This page exists to be used. Developers answering a county board, officials evaluating a proposal, and residents who want to ask sharper questions may cite or reproduce these figures and comparisons with attribution and a link. Copy the block below into a letter, a staff memo or public testimony as it stands — the attribution line keeps the source checkable:
Seven questions to ask any data center project about water
1. Is normal-duty cooling evaporative, or dry (air-side)?
2. What is the design water draw — at peak, and averaged per day?
3. Is the coolant loop closed, or is water consumed by evaporation?
4. What triggers wet operation, and at what rate per hour?
5. How many hours a year is spray operation expected to run?
6. Does the stated make-up include blowdown?
7. What is the one-time first fill, and where does it come from?
Source: K&K Data Service Inc. — kkdatasvc.com/lab/data-center-water-usage (reference design figures and drawings published at kkdatasvc.com/lab/downloads)
A project that publishes those answers — as we have here, with the drawings to check them against — has little to hide.
How to Cite This Page
This analysis is also published as a design-study preprint with a DOI — the preferred citation for articles, filings and public records:
Liang, R. (2026). Water Use of a Dry-Cooled, Closed-Loop GB300-Class Data Center: A Reference-Design Study. Zenodo. https://doi.org/10.5281/zenodo.23245321
To cite this page directly:
K&K Data Service Inc., “Data Center Water Usage: a GB300-class reference design at ~40,000 gallons per decade” (2026), https://www.kkdatasvc.com/lab/data-center-water-usage/ — design-basis figures with published drawings at https://www.kkdatasvc.com/lab/downloads/
The figures, the comparison and the question list may be reproduced with that attribution; drawing images may be embedded per the reuse terms.
Sources
- Environmental and Energy Study Institute, Data Centers and Water Consumption — large-facility ceiling.
- The Brookings Institution, Why water is important for data centers — commonly cited mid-size figure.
- Lawrence Berkeley National Laboratory, 2024 United States Data Center Energy Usage Report — 2023 US direct (17B gal) and indirect (211B gal) data center water.
- Google, 2024 Environmental Report — 2023 water consumption across data centers and offices.
- Microsoft, Sustainable by design: next-generation datacenters consume zero water for cooling (December 2024).
- US EPA WaterSense, household water statistics.
Industry figures above are the sources’ reported values, quoted for comparison; this page’s own figures are design-basis planning inputs of the K&K reference design.
Download the Drawing Set
Every document is a direct PDF download — no registration, no email gate — with a published SHA-256 checksum on the downloads page:
- Electrical Drawing Book — Public Edition P1 (14 MB, 88 pages)
- Structural Document Set — Public Edition P1 (84 MB, 170 pages)
- GPU Hall Network Reference Design — Public Edition P2 (1.6 MB, 75 pages)
- Liquid Cooling Reference Design — Public Edition P1 (3.1 MB, 38 pages)
- BIM Machine-Audit Sample Pack (5 KB, 4 artifacts + README)
- Storage-Capacity Model — Companion Code (34 KB, code + dataset)
- GPU Hall Design Readiness Checklist (7 KB, 2 pages)
- Machine-Audit Template Pack (3 KB, 3 templates + README)
- Electrical + Structural + Network — Combined ZIP (97 MB, 3 documents)
Published at Design Development — Public Edition P1 status: reference designs for study and evaluation, not construction issues, not sealed by an Engineer of Record. Reuse follows the attribution terms stated inside each document.
Common Questions
Do data centers really use millions of gallons of water a day?
The reported figures are real, and they describe a design choice rather than a fixed cost of computing: facilities that reject heat by evaporating water reach the reported millions of gallons per day at large scale, while a dry-cooled, closed-loop design rejects the same heat to air. This page publishes a complete GB300-class counterexample to the gallon: zero evaporative use in normal duty and about 39,600 gallons across ten years of bounded emergency wet-assist, with the drawings and a DOI-registered study to check the arithmetic against.
How much water does a data center use?
Reported figures for evaporatively cooled facilities run up to about 300,000 gallons per day for a mid-sized site and up to 5 million gallons per day for a large one. US data centers consumed about 17 billion gallons directly for cooling in 2023 (LBNL). The dry-cooled reference design on this page is planned around zero evaporative use in normal operation and about 39,600 gallons over ten years of emergency wet-assist.
Can a data center run without consuming water?
In normal operation, yes, by design choice: dry coolers reject heat to air and a closed coolant loop is not consumed. The cost appears as more dry-cooler capacity instead of water. This reference design keeps evaporative wet-assist only as a bounded exception mode for sustained heat or equipment outage.
What is the water actually used for in a liquid-cooled data center?
Three distinct things, often conflated: a one-time coolant first fill (here about 30 tonnes of premixed PG25, supplier-delivered); evaporative makeup water, which this design uses only in emergency wet-assist (planning peak about 6.6 gallons/minute); and ordinary sanitary water for staff. The closed loop itself does not consume coolant in normal duty.
What should a city or county ask a data center project about water?
Seven things settle most of the picture: whether normal-duty cooling is evaporative or dry; the design water draw at peak and averaged per day; whether the coolant loop is closed; what triggers wet operation and at what hourly rate; how many hours a year spray is expected to run; whether stated make-up includes blowdown; and the one-time first fill and its source. This page publishes those answers for our reference design, and the question block above may be copied into staff memos and public testimony with attribution.
What would it take to apply these numbers to a real site?
Four standard engineering steps: set the wet-assist threshold from the site's dry-bulb statistics, size the makeup rate from the selected coolers' duty models, confirm the first fill from the as-piped system volume, and replace the planning figures with commissioning records once operating. The figures here are the published design basis those steps start from; the industry comparison figures are the sources' reported values.
Questions about any sheet or parameter: inquiry@kkdatasvc.com or the contact page.