
The Numbers Behind a GB300-Class Data Center, With Sources
Writers and engineers keep needing the same numbers — and the vendor sources are gated. This page collects the working figures of our published reference design, each with its maturity label, a one-line explanation and a deep-linkable source. Cite them freely with attribution.
Power
136 kW per rack, A/B dual feed
IT design basis of the electrical reference design: 136 kW per rack with 50/50 normal sharing across dual inputs. [design basis] Source · #
952 kW normal / 1428 kW single-path outage
Per-path IT duty on a six-path, 42-rack zone: what one power path carries normally, and what it must carry when its partner path is out. [design basis] Source · #
2 MW UPS design duty per path
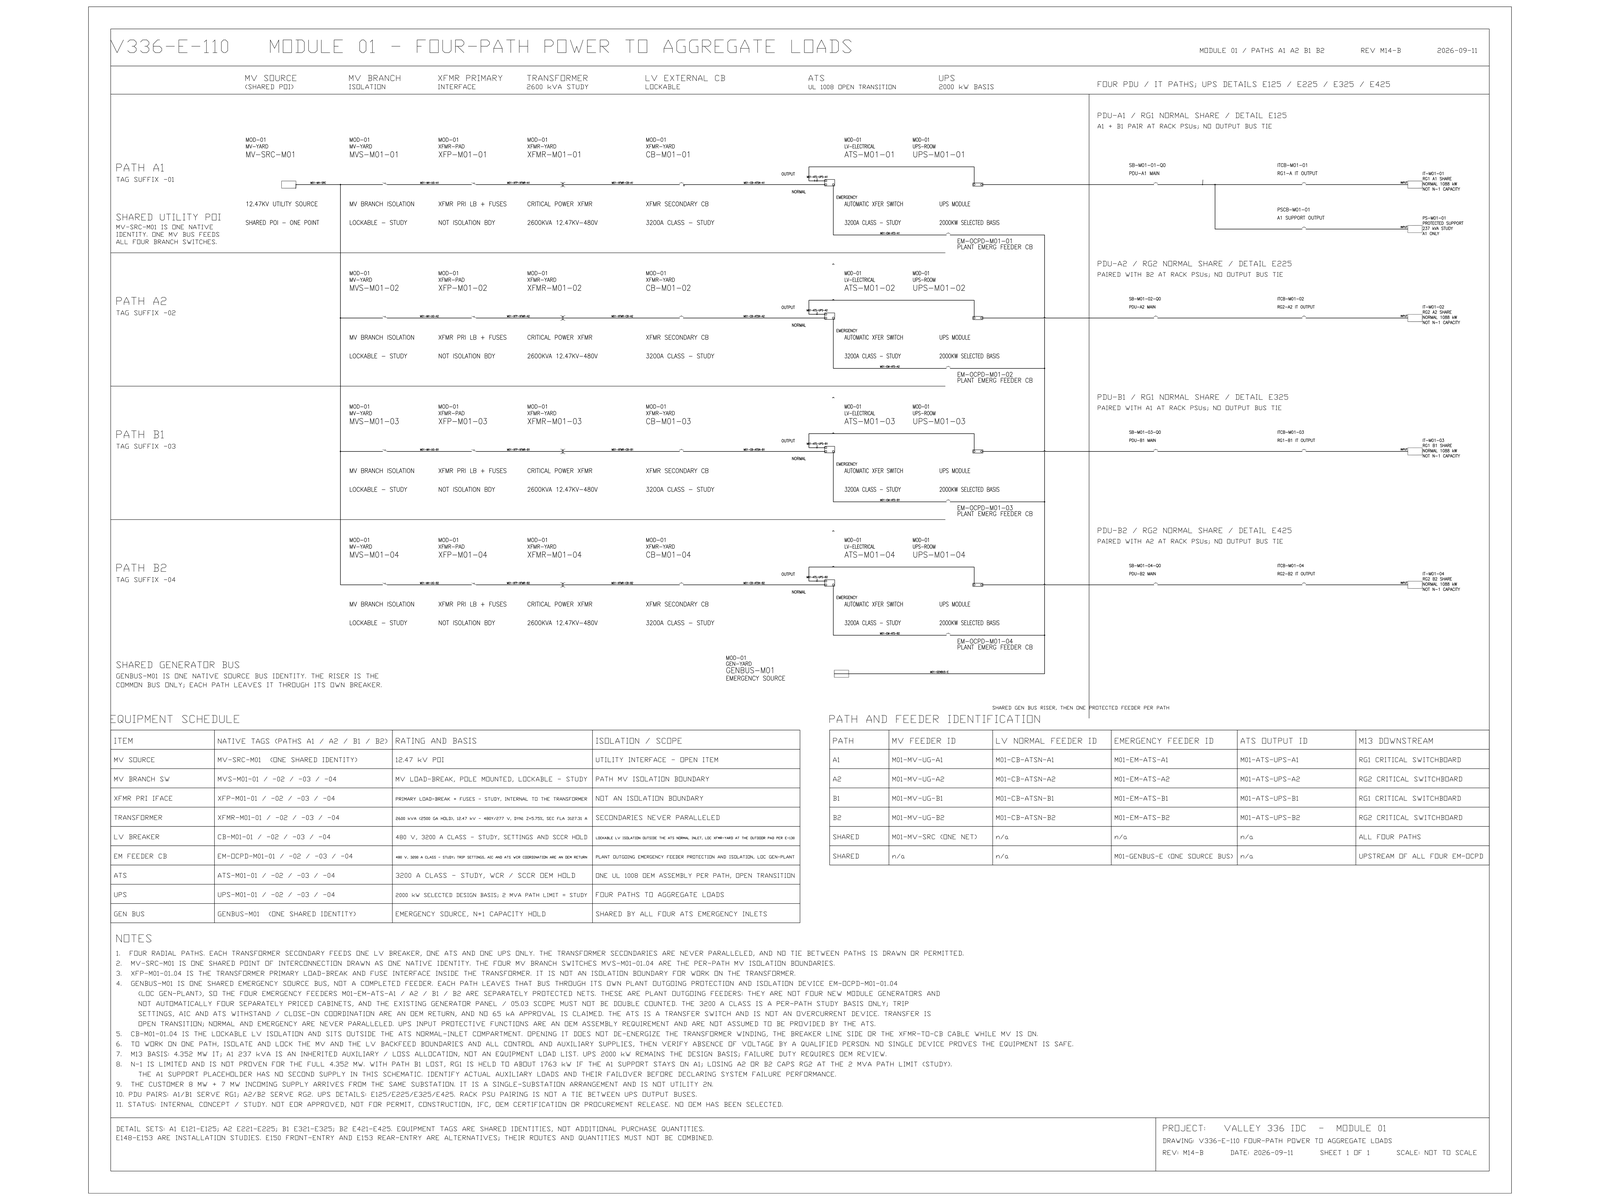
Each radial path carries one UPS block at 2 MW design duty; a 2 x 1200 kVA/kW frame is the stated candidate. Independent UPS outputs are kept un-paralleled. [design basis] Source · #
A 42-rack GPU zone is roughly a 5.7 MW electrical block
42 racks x 136 kW: one hall zone of a GB300-class facility is the size of a whole traditional data center. [arithmetic on the design basis] Source · #
2500 kVA, 12.47 kV to 480Y/277 V, one transformer per path
Critical-power transformer calculation basis on every radial path; each secondary feeds exactly one LV breaker, one ATS and one UPS. [design basis] Source · #
16 x 1 MW generator plant in 4 sections with 3 sync-check couplers
Generator plant study basis serving 13 UPS feeders; first machine closes to a verified dead bus, everything after needs a synchronism-check permissive. [study basis] Source · #
Half a point of UPS efficiency moves 65 kW against an 85 kW utility margin
Why partial-load UPS efficiency is a procurement number, not a datasheet footnote: at this design's scale, 0.5% of efficiency is 65 kW of continuous load against a thin utility margin. [arithmetic on the design basis] Source · #
Cooling
A water-rated 1.5 MW CDU delivers about 1.20–1.28 MW on PG25
Nameplate CDU ratings are stated on water; on 25% propylene glycol the modeled delivered capacity drops 15–20%. [modeled] Source · #
155 kW sustained per rack, 95% heat rejection to liquid
Sizing basis of the liquid-cooling set (V8.5): 883.50 kW per 6-rack unit, 2,650.50 kW per 18-rack group, 13.2525 MW liquid load across 90 racks. A deliberately heavier basis than the electrical set's 136 kW IT figure — each discipline states its own. [design assumption] Source · #
A 90-second source transfer at 330 m³/h needs 8.25 m³ of deliverable cold liquid
Why buffer tanks are sized the way they are: the stated transfer-event requirement works out to 8.25 m³ of cold volume; a 15 m³ nominal buffer per ring carries it with stratification margin. [design requirement] Source · #
Structure
Site and civil
60 inches of conduit cover; ~1788 mm excavation
Adopted medium-voltage buried-crossing basis under the shared heavy-vehicle road: 114.3 mm conduit OD plus 150 mm bed gives roughly 1788 mm of excavation — deep enough that worker entry needs an OSHA 1926.652 protective system. [design basis] Source · #
Water
No evaporative water consumption in normal operation, by design
Dry coolers carry normal duty and the PG25 loop is closed; evaporative wet-assist exists only as a bounded exception mode for sustained heat or dry-cooler outage. [design basis] Source · #
First fill ≈30 t premixed coolant (≈7,700 US gal), one-time, supplier-delivered
A one-time system inventory with a ±30% engineering range — not municipal water and not a recurring draw. [design basis] Source · #
Ten-year emergency-water planning allowance ≈150 t ≈ 39,600 US gallons
One hundred hours at the 1.5 t/h make-up allowance — about 11.4 minutes of the reported 5-million-gallon-per-day ceiling for a large facility; a site whose counted spray hours exceed the budget scales it in proportion. [planning allowance] Source · #
Scale of the published record
How to cite these numbers
Every figure on this page is published in the K&K reference drawing set or the Data Center Lab, with its maturity stated in the bracket: a design basis is what the drawings are engineered around, a modeled figure is calculated analysis, a requirement is a stated performance target — none of them are field measurements. Cite freely with attribution: link either this page (each number has a # anchor) or the linked source. These are reference-design figures for study and evaluation; verify against your own equipment data before use.
Reusing the drawings and figures
The drawing images published on this site (one-line diagrams, equipment plans, sheet renders) may be reused in articles, presentations and teaching material with visible attribution to K&K Data Service Inc. and a link to kkdatasvc.com. The PDF sets carry their own attribution terms inside each document. For other uses, write to inquiry@kkdatasvc.com.
Download the Drawing Set
Every document is a direct PDF download — no registration, no email gate — with a published SHA-256 checksum on the downloads page:
- Electrical Drawing Book — Public Edition P1 (14 MB, 88 pages)
- Structural Document Set — Public Edition P1 (84 MB, 170 pages)
- GPU Hall Network Reference Design — Public Edition P2 (1.6 MB, 75 pages)
- Liquid Cooling Reference Design — Public Edition P1 (3.1 MB, 38 pages)
- BIM Machine-Audit Sample Pack (5 KB, 4 artifacts + README)
- Storage-Capacity Model — Companion Code (34 KB, code + dataset)
- GPU Hall Design Readiness Checklist (7 KB, 2 pages)
- Machine-Audit Template Pack (3 KB, 3 templates + README)
- Electrical + Structural + Network — Combined ZIP (97 MB, 3 documents)
Published at Design Development — Public Edition P1 status: reference designs for study and evaluation, not construction issues, not sealed by an Engineer of Record. Reuse follows the attribution terms stated inside each document.
Common Questions
How much power does a GB300-class rack actually draw?
Published rack-scale figures are on the order of 135–150 kW, fully liquid cooled. The reference design on this site carries a 136 kW-per-rack electrical IT basis and a deliberately heavier 155 kW sustained basis in its liquid-cooling sizing — both stated with their assumptions.
Are these numbers measured from a real facility?
No, and the page says so on every figure: they are design bases, modeled analysis and stated requirements from a published reference design (Design Development — Public Edition), not field measurements. That honesty is the point — each figure links its source so you can judge it.
Can I use these numbers in my own article or deck?
Yes — cite the page or the linked source with attribution. Each figure has a # anchor for deep linking. Drawing images may be embedded with visible attribution and a link.
Questions about any sheet or parameter: inquiry@kkdatasvc.com or the contact page.