
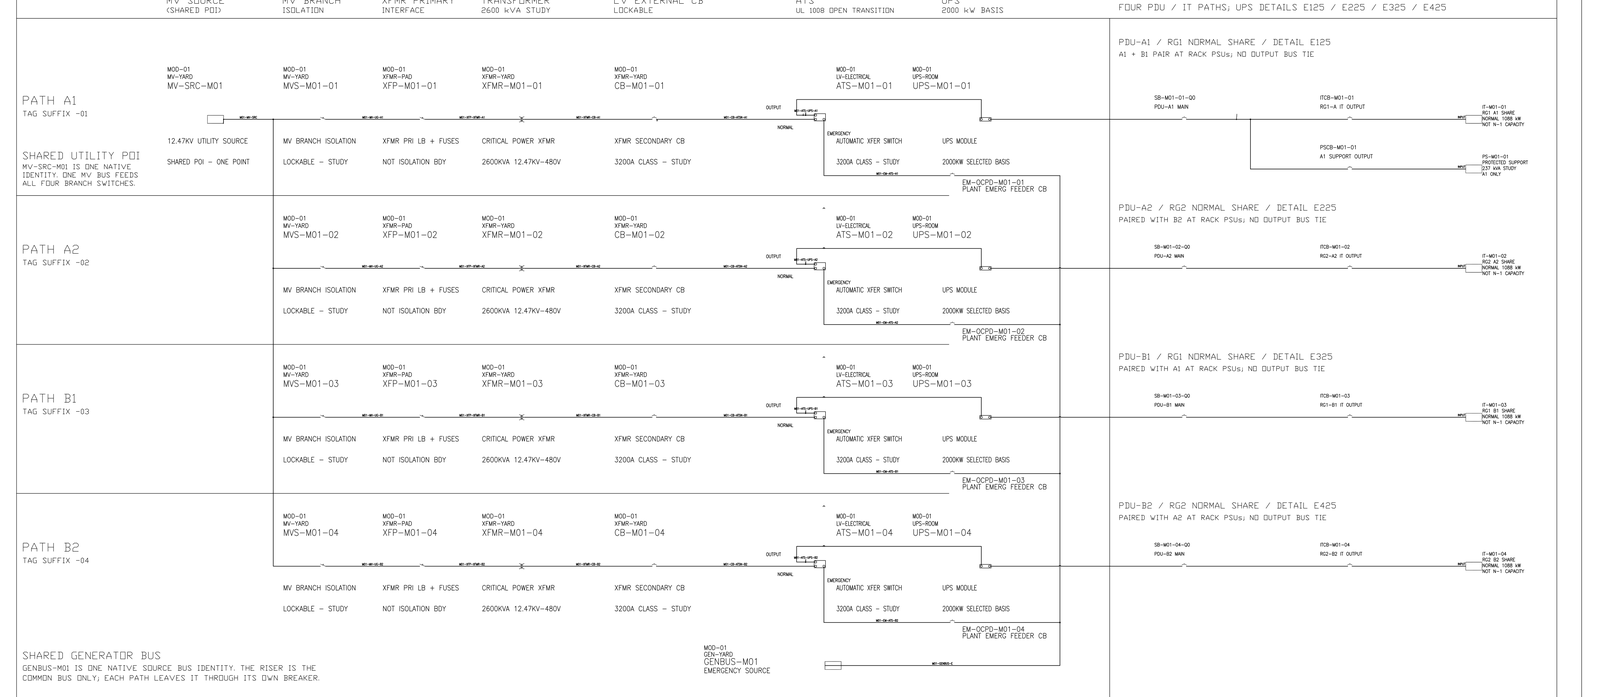
In the three-column facility load schedule of the heat-rejection basis, the uninterruptible-supply double-conversion loss line is the largest single non-information-technology entry in the whole table: 454 kW [MODELED] and 448 kW [MODELED] in the two baseline columns at an assumed 96.5 % [MODELED] efficiency, and 545 kW [MODELED] in the conservative column at 96.0 % [MODELED]. Immediately under it, the author records the sensitivity that makes the line interesting rather than merely large — a half-point movement in that efficiency shifts facility power by about 65 kW [SENSITIVITY]. The non-critical utility line in the same table, which carries white-space and grey-space lighting, offices, ventilation auxiliaries and maintenance receptacles for the entire site, is 85 kW [MODELED] in the two baseline columns. Sixty-five is not eighty-five. They are the same order.
UPS Loss Is the Largest Non-IT Line on the Schedule
The schedule does not print the arithmetic, so here it is with its ambiguity intact. Double-conversion loss on a protected load P at efficiency η is P(1−η)/η, and the derivative with respect to efficiency is P/η². Against the protected load of 12,711 kW [MODELED] that the electrical closure record arithmetic sums, a 0.005 change gives 12,711 × 0.005 ÷ 0.965² = 68.2 kW [SENSITIVITY]. Under the looser convention P × Δη, the same 0.005 gives 63.6 kW [SENSITIVITY]. The source states about 65 kW and does not say which convention produced it. The two bracket it, and a reviewer repeating the calculation will land inside a 5 kW [SENSITIVITY] spread rather than on the printed figure.
That spread is smaller than the thing being compared, so the comparison survives it. What does not survive is any use of 65 kW as a precise quantity.
The 96.5 % figure is a near-full-load value. Under strict 2N, with dual-cord load split across both paths, each module then runs at 45.4 % [MODELED] of its rating. The record registers that actual double-conversion efficiency at 45 % to 53 % [SENSITIVITY] module loading typically falls 0.5 to 1.5 percentage points [SENSITIVITY] below the near-full-load number. The module count produced by the sizing rule places the modules at an operating point where the efficiency input to that same rule is not the right one.
The Efficiency Move Is Comparable to the House Load
Naming the non-critical utility line as the yardstick is not rhetoric about lighting. It is a statement about what is negotiable.
The utility line is the entry a facility team can actually attack — fixtures, controls, office conditioning, receptacle diversity — and in the conservative column it is already assumed to grow to 150 kW [MODELED] on unfrozen building area. Its whole baseline value is 85 kW. So the entire negotiable non-critical utility budget is worth about one and a quarter half-points of uninterruptible-supply efficiency, and the efficiency number is one line in a supplier's quotation.
The schedule also fixes what that comparison is worth against the contract. The baseline column closes at a power usage effectiveness of 1.177 [MODELED] against a contract basis of 1.20 [TARGET], leaving 275 kW [MODELED] of headroom, which the author converts to about 0.023 [MODELED] of effectiveness. Set against the same table's own spreads — 255 kW [SENSITIVITY] across the heat-rejection fan band, 750 kW [SENSITIVITY] between the baseline and conservative mechanical-cooling entries — the headroom is narrower than one item's uncertainty.
Hourly Efficiency Curves Have Not Been Obtained
Two things about the efficiency figure are recorded as unclosed, and both point the same way.
First, 96.5 % is prohibited from being frozen. The shared engineering register lists it alongside the generator derating factor and the five-minute battery floor as values that may not be frozen, and the electrical closure review accepts the sums while refusing the components. The 454 kW is therefore a number computed from an assumption, not a loss anyone has confirmed.
Second, the schedule's own method section rules that transformer, uninterruptible-supply and distribution losses must be computed hourly against each device's load-factor-versus-efficiency curve, and that applying a design-point percentage across the year is prohibited. Those curves have not been obtained. The author's judgement on that gap is blunt: annual effectiveness is more sensitive to the electrical loss column than to the sum of every cooling-side optimisation, so obtaining cooling equipment curves alone leaves annual effectiveness uncomputable.
That second point sharpens the first. Part-load efficiency is worse than full-load efficiency, and the ramp period runs at low load factor, so a single full-load figure biases the early operating years in one direction.
Limits and open items
Fixed as method: the efficiency line is the largest single non-information-technology entry, and the hourly-curve rule governs how it must be computed. [FACT]
Floating: 454 kW, 448 kW, 545 kW, 85 kW, 150 kW, 275 kW and 1.177, all of which move if the efficiency assumption, the auxiliary load or the building area moves. The 65 kW sensitivity and the 68.2 / 63.6 kW reproductions move with them. [MODELED]
Forbidden: quoting 1.20 as achievable. The author's own instruction is that a conclusion overturned by the unfavourable end of any single line item may not be published as attainable, and grades it a parameterised estimate from engineering experience rather than a demonstrated result. Nothing here reflects Engineer of Record review, equipment supplier confirmation, commissioning acceptance or measured plant behaviour, and no efficiency figure here is a product selection.
The Quotation Must Ask for a Load-Factor Curve
The practical consequence is about what a request for quotation asks for. The schedule's recommendation is that the supplier submit a full load-factor efficiency curve rather than a single full-load point, and it places that ahead of cooling-scheme detail in priority. A design team cannot close this line by designing. It closes when a curve arrives.
One condition would change the conclusion. If the load-factor curve comes back flat enough across the operating band that the difference between design-point and hourly integration falls below the 85 kW utility line, then the half-point sensitivity stops being a schedule-level concern and becomes an ordinary equipment comparison. Nothing in the read set indicates which way that lands, and the schedule declines to assume it.
© 2026 K&K Data Service Inc. All rights reserved. Reproduction or republication is permitted only with clear attribution to K&K Data Service Inc. and a working hyperlink to the canonical URL of this article. Excerpts must preserve the technical context, maturity labels, assumptions, and limitations. No excerpt may imply project approval, field validation, certification, or endorsement that the original article does not state.
Source: K&K Data Service Inc., “A 0.5-Point UPS Efficiency Change Moves About 65 kW of Facility Load,” https://www.kkdatasvc.com/lab/ups-battery-and-generation/half-a-point-of-ups-efficiency-moves-65-kw-against-an-85-kw-utility-line/.
Request the Public Calculation Note. If your project record shows a different result, or the same failure domain under another name, we want to see it. Email inquiry@kkdatasvc.com or use the contact page.