
The first freezable item in the Gate 1 closure record carries 15 MW [TARGET] as a facility input ceiling and 12 MW [TARGET] as billable IT. A different document applies a 125 % [MODELED] continuous-load factor when device frames and conductors are selected. Those two constraints are habitually written as one. They differ in unit, in owner and in what happens when each is breached. The cap limits demand at a single point. The factor raises ratings at many points and lowers nothing. Satisfying either says nothing about the other. What follows is how both are used on this record, not a determination of code applicability.
The Cap Limits Demand; the 125% Factor Raises Ratings
The 15,000 kW [TARGET] figure is a facility input ceiling carried in the controlled fixed-fact register. The register is explicit that it is not an IT capacity basis. The heat-rejection basis states the breach consequence plainly: exceeding it voids the electrical interconnection arrangement, which then has to be re-applied for, with the medium-voltage and feeder design redone. No measurement window or accounting convention argues that away.
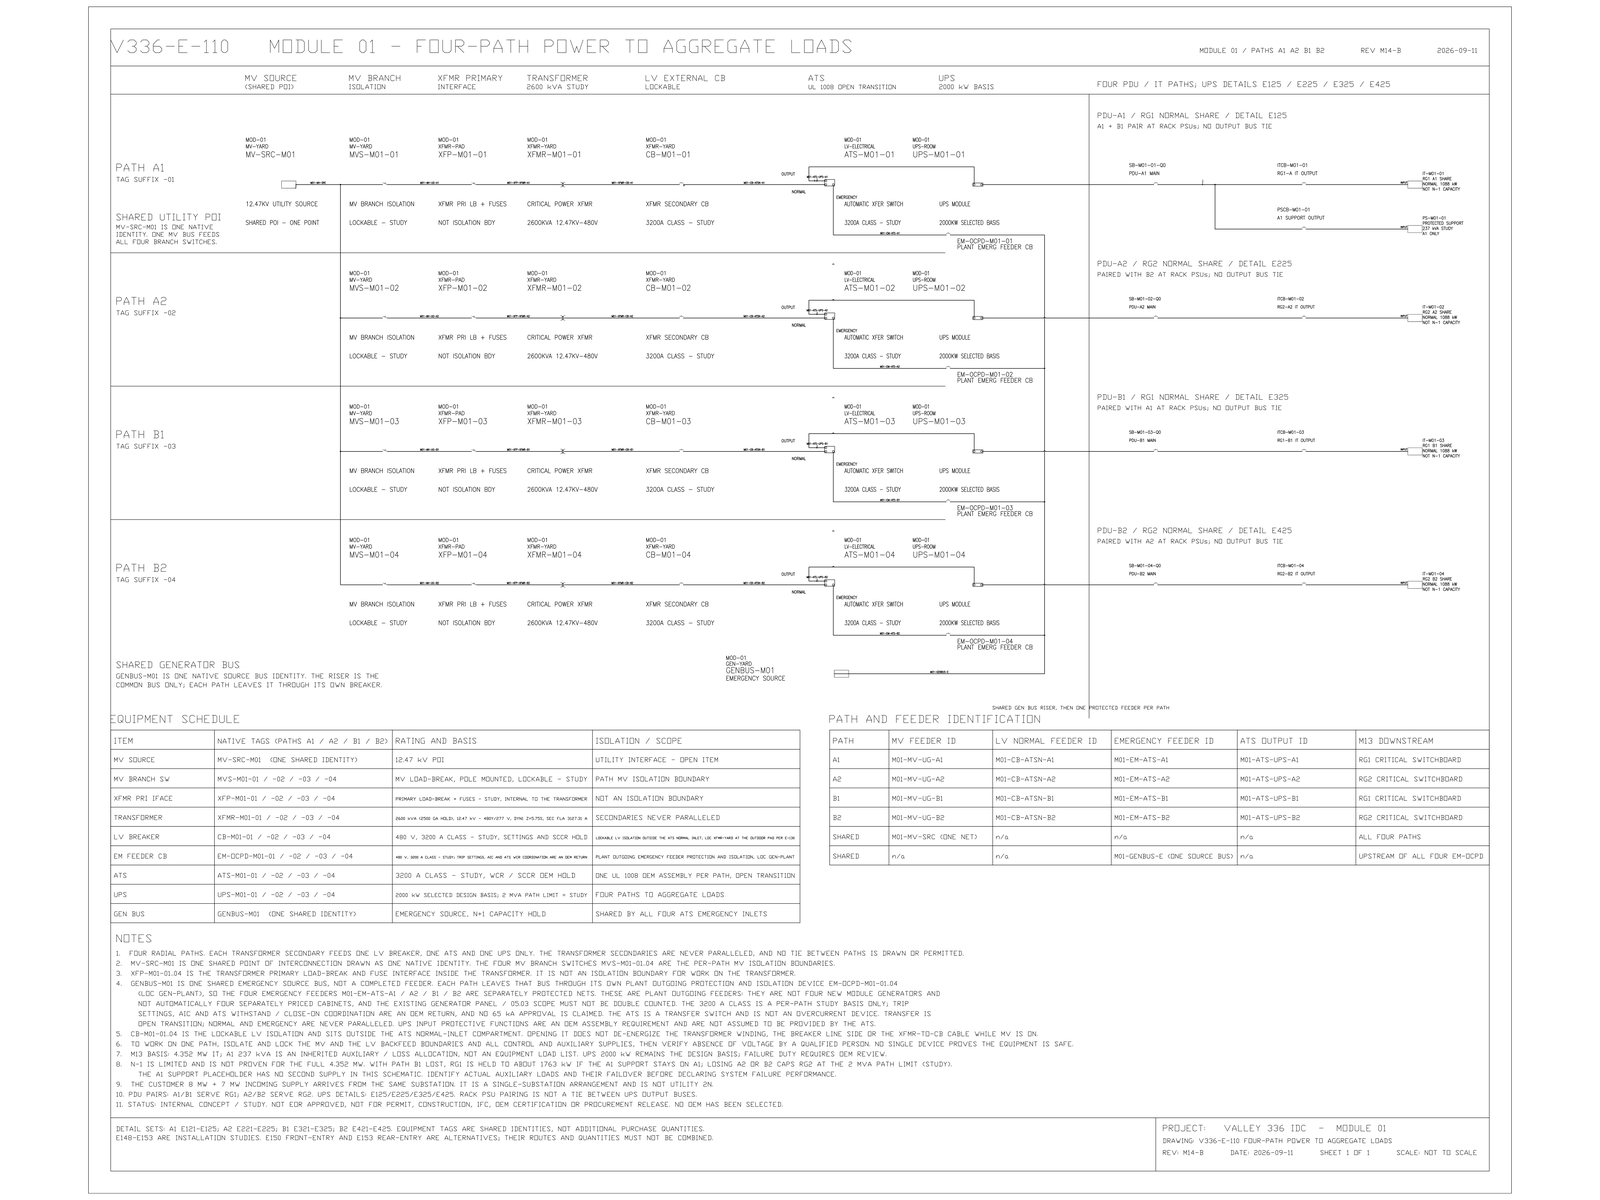
By contrast, the 125 % factor is a rating multiplier. Applied to a load classified as continuous, it sets the frame and the conductor — a 2,000 kW [MODELED] UPS output is 2,430 A [MODELED], and 2,430 × 1.25 = 3,038 A [MODELED], met by a 3,200 A [MODELED] frame or a 100 %-rated 3,000 A [MODELED] device. It changes no demand figure anywhere. It is owned by the Engineer of Record applying the governing code, whereas the cap is owned by the service agreement with the serving utility. Collapsing them produces a specific and recognisable error: a design that reports 14.391 MW [MODELED] against a 15 MW cap and concludes there is headroom, while every device downstream has been selected on a figure that is a quarter higher and a different quantity entirely.
Three medium-voltage selections the factor did not make
The design basis applies the factor at three points on the medium-voltage side. The worked lines are instructive for a reason that has nothing to do with the factor:
bus continuous      14,391 / (sqrt(3) x 12.47 x 0.95) = 702 A ; x 1.25 = 878 A -> 2,000 A selected
service incomer      8,000 / (sqrt(3) x 12.47 x 0.95) = 390 A ; x 1.25 = 488 A -> 1,200 A selected
transformer feeder   2,500 / (sqrt(3) x 12.47) = 116 A ; four on a ring = 463 A ; x 1.25 = 579 A -> 630 A selected
None of the three lines had its selected rating produced by the factor. Selection put the bus at 2,000 A [MODELED] against a factored 878 A [MODELED], and the incomer at 1,200 A [MODELED] against 488 A [MODELED]. Those margins come from standard rating steps and from what switchgear frames are actually built in, not from the 1.25. Anyone reasoning backward from a nameplate to a load will therefore be wrong by a large and inconsistent amount. That is the second reason the two numbers cannot be merged into a single "service rating" line.
The Contract Figure Is Reached Before the 15 MW Cap
The heat-rejection basis insists on separating the physical ceiling from a contract figure of 14,400 kW [TARGET], which is the contracted efficiency basis of PUE 1.20 [TARGET] expressed as a power: 12,000 kW × 1.20 = 14,400 kW. Breaching the contract figure is a commercial exposure that can be argued on measurement window and methodology. Breaching the physical ceiling cannot be argued at all. Under that record's baseline column, steady facility demand is 14,125 kW [MODELED] — 275 kW [MODELED] below the contract figure and 875 kW [MODELED] below the physical ceiling, falling to 642 kW [MODELED] of margin once battery recharge is included in the envelope.
Ordering is what matters here. The first limit to be reached is the commercial one. Commercial exposure can be mitigated by negotiation, definition or operating adjustment without changing hardware. Reporting a single "margin to 15 MW" hides that ordering, and with it the fact that the cheaper problem arrives first.
Limits and open items
Confirmed: 15,000 kW is a facility input ceiling and not an IT capacity basis; 14,400 kW is a contract efficiency basis and a different quantity; the design basis applies a 125 % factor to loads it treats as continuous; the selected ratings quoted above come from standard steps. [FACT]
Modelled and unfrozen: 702 A, 878 A, 390 A, 488 A, 116 A, 463 A, 579 A, 2,430 A, 3,038 A, 14,125 kW, and the 875 kW and 642 kW margins. The 0.95 medium-voltage and 0.99 low-voltage power factors and the grouping of four transformers per ring are assumptions. [MODELED]
Open: whether any particular load qualifies as continuous is a determination for the Engineer of Record under the governing code and is not made here; the serving utility's system short-circuit contribution is a blocking item, so no interrupting rating is closed; and the ring grouping awaits an Engineer of Record judgement on ring-internal common cause. [HOLD]
One qualification attaches specifically to the 14,125 kW figure and the margins derived from it. The engineering record states that the weather chain behind that column was developed against the wrong location. Until a site-correct recomputation is completed, all weather-dependent temperatures, heat-rejection boundaries and annual efficiency figures in that document are formula templates without site effect. The 875 kW and 642 kW margins therefore carry that status and are not site results. A site-correct recomputation could move them in either direction. The physical-versus-contract distinction above is what survives regardless.
No rating, margin or classification here has been reviewed or sealed by an Engineer of Record. Nothing is released for purchase.
Which of Four Quantities Is the Service Rating
All of these numbers converge on one sheet — the single line that shows a service rating. If that sheet carries one figure, a reader cannot tell whether it is the demand ceiling, the calculated continuous current, the factored current or the selected frame. All four are legitimately present in the same drawing set. The cheapest available correction on this record is a column heading, not a calculation. On your service sheet, which of the four does the number currently mean?
© 2026 K&K Data Service Inc. All rights reserved. Reproduction or republication is permitted only with clear attribution to K&K Data Service Inc. and a working hyperlink to the canonical URL of this article. Excerpts must preserve the technical context, maturity labels, assumptions, and limitations. No excerpt may imply project approval, field validation, certification, or endorsement that the original article does not state.
Source: K&K Data Service Inc., “The 15 MW Service Cap and the 125% Conductor Rule Are Different Limits,” https://www.kkdatasvc.com/lab/electrical-architecture-and-failure-domains/the-service-cap-and-the-125-percent-rule-are-different-numbers/.
Request the Public Calculation Note. If your project record shows a different result, or the same failure domain under another name, we want to see it. Email inquiry@kkdatasvc.com or use the contact page.